- Research
- Open access
- Published:
Frequency-division-multiplexing based period-coded fringe pattern for reliable depth sensing
Journal of the European Optical Society-Rapid Publications volume 14, Article number: 2 (2018)
Abstract
The fringe pattern can realize high-resolution and dense depth sensing. However, the phase ambiguity is a challenge in the fringe pattern. In this paper, one period-code pattern is embedded to the fringe pattern by the frequency-division-multiplexing (FDM) framework. The nonparametric skew and De Bruijn sequence are utilized to determine the label of the period. For a more reliable phase unwrapping, three criteria are utilized to rectify the period numbers further. Quantitative and qualitative experiments show that the proposed method can achieve more reliable depth sensing compared with the counterparts. Even the measured scene contains discontinuous surfaces or sharp edges, the proposed algorithm can attain reliable depth.
Background
Depth data has extensive applications in manufacturing, entertainment, object recognition, surveillance, etc. The widely used structured light illumination (SLI) method is one kind of noncontact and active depth sensing approaches. There are always a projector and a camera in the SLI system. The projector casts the elaborately designed patters onto the scene and the camera records the images. When the correspondence between the patterns and the images are determined, the depth data is calculated according to the projector-camera geometric relationship.
The SLI is classified into single-shot and multiple-shot methods [1]. The single-shot algorithms only need to cast one pattern. These techniques use continuous varying pattern [2], stripe coding pattern [3–5], grid coding pattern [6, 7], etc. To improve the robustness of these algorithms, color variation [3, 5, 7], certain symbols [4, 8], and pseudo random property [5, 7] have been adopted to code the pattern. However, the color pattern might be influenced by the textures of the scene. The coded spatial information might be destroyed by the dramatic change of depth. Therefore, the precision of the single-shot methods is limited.
The multiple-shot methods project a set of patterns onto the scene. The binary patterns [9], gray patterns [10, 11], phase shifting patterns [12] have been proposed. Because each pixel is coded by a unique temporal code word, the multiple-shot algorithms have high precision. But these methods consume more time than the single-shot methods.
The typical fringe pattern can attain dense depth map. However, due to the periodical nature of the fringe signal, a major problem of this technique is the phase ambiguity [13]. It is especially difficult to solve the ambiguity when the scene has multiple isolated objects or abrupt depth changes.
In this paper, a single-shot period-coded fringe pattern is proposed for depth sensing. To relieve the phase ambiguity of the fringe pattern, another pattern is used to code the period numbers of the fringe. Instead of projecting the fringe pattern and period-code pattern sequentially, these two patterns are modulated into one-shot pattern based on the frequency-division-multiplexing (FDM) in communication systems.
To improve the robustness of the proposed method, the De Bruijn sequence is adopted to code the period numbers. In the proposed depth sensing algorithm, after demodulating the captured image, the wrapped phase is recovered through the Gabor filter. From the wrapped phase, the continuous regions are detected. The phase unwrapping is conducted in each continuous region. We first extract period numbers according to the unique De Bruijn subsequence. And the period numbers are rectified based on three proposed criteria.
Experiments have been carried out to verify the performance of the proposed method. Results of the experiments demonstrate that the proposed method is robust to the complex scenes with multiple objects. The proposed region detection algorithm can determine the continuous regions in the scene successfully. And the three proposed criteria help to improve the reliability of the period numbers. The quantitative evaluation also shows that the proposed method achieves higher precision.
Related work
The fringe pattern whose intensities vary in accordance with the sinusoidal wave is a classic structured light pattern for depth sensing. One outstanding feature of this fringe projection method is that it can provide high-resolution, whole-field 3D reconstruction of objects [14]. However, the phase unwrapping is inevitable in this algorithm.
In the fringe projection methods, the wrapped phase can be recovered from the captured image by phase shifting [12, 15], Fourier transform [2], windowed Fourier transform [16], wavelet transform [17], and Gabor transform [18], etc. Because the range of the wrapped phase is limited to (−π,+π] mathematically, the period number is needed to get the unwrapped phase for correspondence. Various phase unwrapping algorithms have been proposed, such as quality-guided flood-fill [19], branch-cut [20], region growing [21], network approach [22], etc. However, these phase unwrapping methods are generally based on the assumption that the depth is smooth. If there are isolated objects or surfaces with large depth variations, the phase unwrapping might occur serious errors.
To reduce the computation complexity, some researchers use extra patterns to assist the phase unwrapping process. Zheng, et. al adopted six additional patterns to code the periods [23]. Wang, et. al proposed a method that used three extra patterns and phase information to determine the codewords [24]. One additional stair pattern was designed in [25]. Though the changes of the stair are aligned with the phase jumps, the stair image normalization might not be so reliable because of the quantization error.
Some researchers have made efforts to embed certain period markers without increasing the number of required patterns. In order to retain the signal-to-noise ratio of the phase shifting, Wang, et. al utilized an optimization procedure to determine how to embed the period cue into the pattern set [26]. Zhang, et. al added speckle-like signals in three sinusoidal fringe patterns [27, 28]. But the embedded marker might be ruined when the surfaces have abrupt depth changes. The square wave was adopted to encode the three fringe patterns in [29]. Based on the coprime theorem, the unwrapped phase is computed pixel by pixel. But it requires multiple patterns to do the depth sensing. In order to achieve the depth sensing with a single-shot pattern, Budianto, et. al added a sequence of impulses into the original fringe pattern [30]. But the embedded impulses bring bias to the fringe and this bias must be removed for reliable phase unwrapping. The encoded cross markers were detected in [31]. But the markers need to be removed by linear interpolatioin further.
The De Bruijn sequence is suitable for encoding patterns [32]. A De Bruijn sequence of order m over an alphabet of n symbols is a circular string of length nm. Each substring of length m exactly appears once in the cycle. The De Bruijn sequence can be obtained by searching Eulerian circuits or Hamiltonian circuits over different kinds of De Bruijn graphs. This pseudorandom sequence has been used to encode grid-based pattern [33] in the colorspace. However, the number of colors used increases the noise sensitivity when measuring colourful scenes [32].
Compared with the previous works, our proposed method has various differences and advantages. Firstly, frequency-division-multiplexing (FDM) is utilized to generate the proposed single-shot pattern. So the fringe pattern and the period-code pattern do not have to be projected sequentially. The period-code information in the proposed single-shot pattern can benefit the phase unwrapping. Because of the property of FDM, the phase information and the period information in the acquired image can be extracted independently.
Secondly, the phase unwrapping is proceeded in each continuous region. In extracted wrapped phase, besides the 2π jumps along the epipolar lines, the wrapped phase is discontinuous at the boundaries of isolated objects or the abrupt variation surfaces. We propose a continuous region detection algorithm to segment the scene into parts of continuous regions. In every continuous region, the wrapped phase only has the 2π jumps along the epipolar lines. This relieves the influence of the discontinuous variation. Therefore, more reliable absolute phase can be attained.
Thirdly, the nonparametric skew is utilized to determine the label of the period. And the De Bruijn sequence is adopted to encode the period numbers. Because the nonparametric skew is not effected by the scale shift and it reveals the left or right skewness well. The period label determined by this statistic is reliable. The unique property of De Bruijn subsequence also benefits the determination of the period numbers.
Fourthly, three criteria are utilized to rectify the period numbers further in the phase unwrapping. In the real complex scene, the captured image contains lots of noise. The period numbers which are obtained by the De Bruijn sequence may not be reliable on some parts of the scene, especially near the boundaries of the continuous regions. The proposed three criteria guarantee the reliability of the period numbers.
Finally, because of the four advantages discussed above, the proposed algorithm attains reliable depth sensing results.
Method
In the proposed depth sensing method, we suppose the optical axes of the projector and the camera are parallel and the epipolar geometry is shown in Fig. 1. Because the epipolar lines in the acquired camera image are along the y-axis, the corresponding pixel pairs A and A′ only have a displacement along the y-axis. It means that the final depth precision of the proposed method only has the relationship with the y-axis resolution theoretically. The proposed algorithm exploits the property that no displacement along the x-axis to modulate the fringe pattern and the period-code pattern.

Epipolar geometry of the proposed method
The acquired image I(x,y) is first demodulated to attain the demodulated image I1′(x,y) and I2′(x,y). As shown in Fig. 2, the wrapped phase φ(x,y) is computed by the Gabor filter from I1′(x,y) and φ(x,y) is adopted for region detection. Based on the result of the region detection, the period cue is determined from I2′(x,y). Then the period numbers are decoded according to the De Brujin sequence. After the unwrapped phase Φ(x,y) is calculated from φ(x,y) and the period numbers, the depth is computed according to the geometric relations of the system.

a flow chart of the proposed method, b the demodulated image I1′(x,y), c the demodulated image I2′(x,y), d the wrapped phase φ(x,y) of \(I^{\prime }_{1}\), e the region detection result, f the period numbers map, g the unwrapped phase Φ(x,y)
Pattern design strategy
In the proposed method, the sinusoidal fringe pattern I1(xp,yp) is assigned as
where (xp,yp) are the projector coordinates, a is the DC component, b is the amplitude of the sinusoidal wave and f p is the frequency of the wave. The intensities of the wave vary periodically. The phase of image I1 is written as
where φ(xp,yp) is the wrapped phase and n is the period number. The wrapped phase is restricted in the range from −π to +π. It contains 2π jumps along the epipolar lines.
The period-code pattern I2(xp,yp) is a binary image. The 2π jumps of the wrapped phase along the epipolar lines slice the I1 pattern into several period bands. I2 codes the period numbers of I1 directly. The maximum intensity of I2 is Imax and the minimum intensity is Imin. Each period band of I2 is labelled as 0 or 1 according to the De Bruijn sequence. If the number of pixels whose intensities are Imin is twice that of pixels who are Imax, the period band is labelled as 0. In the labelled 1 period band, 2/3 percent of pixels are assigned as Imax, and the rest of pixels are Imin. As shown in Fig. 3, the distribution of Imax and Imin varies in I2. One region of I2 is magnified in Fig. 3. The red dotted lines represent the locations of 2π jumps in the wrapped phase. The small patches divided by the dotted lines are labelled 0 or 1 according to the De Bruijn sequence.

One example of I2 that encodes the period numbers
To distinguish the period numbers of I1, the unique subsequences of De Bruijn sequence are adopted. For instance, the De Bruijn sequence for alphabet {0,1} and 4-length subsequence is 0000100110101111. In this case, every contiguous 4-length subsequence only occurs once. These subsequences can be used to label different period numbers of I1. Table 1 is a look-up table between the subsequence and the period number of I1. In this table, every unique 4-length subsequence corresponds with a period number of I1.
We plot one vertical line of I1 and I2 on Fig. 4. As shown in Fig. 4a, the intensity of I1 varies periodically. In Fig. 4b, the wrapped phase of I1 increases from −π to +π in each period. As shown in Fig. 4c, every period is labelled as 0 or 1 according to the De Bruijn sequence. The blue dotted lines in Fig. 4 show that the period jumps in I1 and I2 are aligned.

Plot one vertical line of I1 and I2. a the intensity of I1, b the wrapped phase of I1, c the intensity of I2
The proposed single-shot pattern is obtained by modulating I1 and I2 as shown in Fig. 5. The two carrier wave patterns Ic1(xp,yp) and Ic2(xp,yp) are

Pattern design strategy
where c is the DC component, d is the amplitude of the sinusoidal wave, fc1 and fc2 are the carrier frequencies. The image I1 is multiplied by the carrier wave pattern Ic1 pixel by pixel, and the image I2 times the carrier wave pattern Ic2. The final single-shot pattern is the sum of the two products. The one-shot pattern is represented as
Depth sensing algorithm
The acquired image I(x,y) can be written as
where (x,y) is the coordinates in the acquired image, α(xp,yp) is the albedo of the scene, I0(xp,yp) is the ambient light, fc1′ and fc2′ are the carrier frequencies which are distorted by the scene. I1′(x,y) and I2′(x,y) are the images that should be demodulated. Because of multiplication in Eq. (5), the term I1·c+I2·c is combined into the ambient light I0(xp,yp). The term I1·d is merged into the image I1′(x,y). The term I2·d is merged into the image I2′(x,y). Therefore, the modulated information can be attained by demodulating the images I1′(x,y) and I2′(x,y) from the captured image.
To attain the demodulated image \(I^{\prime }_{1}\) and \(I^{\prime }_{2}\), the acquired image is firstly demodulated. The wrapped phase of \(I^{\prime }_{1}\) is computed by the Gabor filter. By analyzing the wrapped phase, the continuous regions are detected. In each continuous region, the period number is firstly found by the subsequence of the De Bruijn sequence. Then the period numbers are rectified based on the proposed criteria. After the unwrapped phase is computed, the depth is calculated according to the geometric relationship of the depth sensing system.
Image demodulation
The one-dimensional Fourier transform of I(x,y) in the x direction is depicted in Fig. 6. The amplitudes center at frequencies 0, fc1′ and fc2′. The images I1′(x,y) and I2′(x,y) are incorporated in the envelope of the spectrum centered at fc1′ and fc2′ respectively. Therefore, the bandpass filter is used to extract the subband spectrum from the captured image.

One-dimensional Fourier transform of one row in the camera image
The output of the bandpass filter can be written as Ii′(x,y)· cos(2πf′ ci x) i=1,2, this expression is similar to the amplitude modulation (AM) signal in communication systems. A squaring detector and a lowpass filter can be adopted to extract the image Ii′(x,y) i=1,2 from the AM similar signal. The diagram of the demodulation process is depicted in Fig. 7.

Diagram of the demodulation process
Wrapped phase calculation
In the image I1′(x,y), the fringe deforms along the epipolar lines. The Gabor filter is utilized to calculate the wrapped phase. The results of the Gabor filter can be expressed as
where ∗ represents the convolution operation, g(y,λ) is the kernel of the Gabor filter, λ is the wavelength of the Gabor filter. In the proposed method, λ equals the period of the deformed fringe in image I1′(x,y).
The wrapped phase of I1′(x,y) is computed by
where Im(z(x,y)) is the imaginary part of z(x,y), Re(z(x,y)) is the real part. The value of φ(x,y) is constrained in the range from −π to +π. The period numbers need to be determined to get the unwrapped phase.
Phase unwrapping
The wrapped phase we have computed contains 2π jumps along the epipolar lines because of the mathematical constraint. Besides that, the wrapped phase is discontinuous at the boundaries of isolated objects or the abrupt variation surfaces. For reliable phase unwrapping, we first detect the continuous regions, then the unwrapped phase is computed in each continuous region.
Continuous region detection Suppose the wrapped phase of a pixel is φ0. As shown in Fig. 8a, this pixel and its 8-connected pixels are considered to be in the same continuous region if

a the 8-connected neighborhood, b-c some examples of the region detection results
where d(φ0,φ i )= min(|φ i −φ0|,|φ i −φ0+2π|,|φ i −φ0−2π|), φ i is the wrapped phase of the 8-connected pixel, τ1 and τ2 are thresholds.
The two-pass flood-fill algorithm is adopted for the region segmentation. In the first pass, two pixels are assigned the same temporary label if they satisfy Eqs. 9 and 10. The equivalences between temporary labels are recorded in this pass. In the second pass, each pixel is relabeled as the smallest equivalent label. If the area of a region is smaller than a threshold, this region is removed. Figure 8b and c are typical examples of the continuous region detection results. The continuous regions are labeled with different colors.
Decode the period number In each continuous region, the wrapped phase φ(x,y) only has the 2π jumps along the epipolar lines. The 2π jumps indicate the location of each period band. In the proposed method, the label of each period is determined from the intensity distribution in image I2′(x,y) by a statistic. Then, the period number is found according to a look-up table. In order to attain reliable period numbers, they are rectified based on three proposed criteria further.
Because pixels in the image I2′(x,y) are aligned with those in the image I1′(x,y), the segmentations of each period band in the image I2′(x,y) are determined according to the 2π jumps of the wrapped phase φ(x,y). The period bands in one continuous region are labeled as P j (j=1,2,⋯,N). N is the total number of period bands in this continuous region. Suppose there are K pixels in P j . The intensities of these pixels are assigned as a set of r1,r2,r3,⋯,r K . The nonparametric skew of this set is defined as
where \(\mu = \frac {{{r_{1}} + {r_{2}} + \cdots + {r_{K}}}}{K}\), ν is the median of r i and \(\sigma = \sqrt {\frac {1}{K}\sum \limits _{i = 1}^{K} {{{\left ({{r_{i}} - \mu } \right)}^{2}}}}\).
The label of this period band is determined as
where τ3 is a defined threshold. In our pattern design strategy, this label is 0 or 1 according to the intensity distribution in every period band. The maximum intensity of I2 is Imax and the minimum intensity is Imin. Suppose there are N pixels in a period band. In the period band which is labelled as 0, the intensity of \(\frac {2N}{3}\) pixels is Imin and the rest is Imax. In this case, we can easily compute that the mean of intensities \(\mu = \frac {2}{3}{I_{\min }} + \frac {1}{3}{I_{\max }}\), the median of intensities υ=Imin and the standard deviation \(\sigma = \frac {{\sqrt 2 }}{3}\left ({{I_{\max }} - {I_{\min }}} \right)\). According to Eq. (11), the nonparametric skew \(S = \frac {1}{\sqrt 2}\). Similarly, the nonparametric skew \(S = -\frac {1}{\sqrt 2}\) when the period band is labelled as 1. Practically, there is always lots of noise in the captured image. So the nonparametric skew is not so exactly \(\frac {1}{\sqrt 2}\) or \(-\frac {1}{\sqrt 2}\). However, the nonparametric skew is not effected by a scale shift and it reveals the left or right skewness well. In our experiments, τ3 is assigned as a constant according to the signal-to-noise ratio of the acquired image. An empirical value τ3=0.26655 is good enough for almost all the scenes.
When the label of each period is determined, the exact period number can be found according to the De Bruijn sequence. If the length of subsequence is 4, the period number n can be searched from every contiguous 4-length subsequence based on the Table 1.
However, the label of some period might occur errors especially when the period lies in the boundaries of the continuous region. Besides the noise, insufficient pixels in the boundaries are another reason for this error. Therefore, we further propose three criteria for decoding the reliable period numbers.
-
In one continuous region, the period numbers are successive. As shown in Fig. 9, two continuous regions are detected. Region 1 has four period bands and region 2 has six period bands. This criterion means that the period numbers n11, n12, n13, n14 and n21, n22, n23, n24, n25, n26 are successive respectively.
Fig. 9 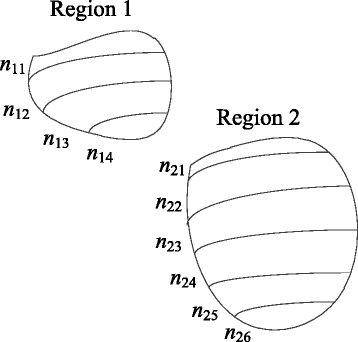
Illustration of the criteria for decoding the period numbers
-
The label of period band which locates near the center of the region is more reliable than that which locates near the boundaries of the region. In Fig. 9, it means that the period numbers n12,n13 are more reliable than n11,n14. The period numbers n22,n23,n24,n25 are more reliable than n21,n26.
-
Suppose no pixels are disorder or disappear resulting from the occlusion of objects. From the top to the bottom of the image I2′(x,y), the period numbers increase along the epipolar lines. This criterion means that n11<n12<n13<n14 and n21<n22<n23<n24<n25<n26 in Fig. 9. Because the region 1 locates upper than the region 2. Restricted by the geometric constraints, the period number n14 is less than n21.

After the period numbers are recovered from the look-up table, a rectification based on these three criteria will be conducted to determine the final reliable period numbers n. The unwrapped phase of every pixel can be computed according to Eq. 2.
The final depth is calculated by comparing the unwrapped phase of the scene with that of an already known reference plane.
Results and discussion
To verify the performance of the proposed method, we set up an experimental platform with off-the-shelf Point Grey Flea image sensor, the commodity F 1.4/12mm Kowa industrial lens and the TI’s DMD LightCommander device-Light Craft 4500. As shown in Fig. 10, the projector and the camera are aligned and their optical axes are parallel. The epipolar lines on the camera image are along the vertical direction.

Experimental platform
The experimental platform is calibrated in advance. The resolution of the camera is 2048×2048 and the resolution of the projector is 1824×1140. The baseline of the system is 104.19 mm. In our experiments, the projected pattern and the acquired image are both 8-bit grayscale. We first carry out some quantitative experiments to evaluate the precision of the propose method. Then, some qualitative experiments are conducted.
Quantitative experiments
In the first quantitative experiment, the projected pattern is generated according to Eq. 5. The frequency of the modulated fringe image is 1/18 cycles/pixel and the carrier frequencies fc1 and fc2 are 1/14 and 1/6 cycles/pixel respectively. We measure a slanted plane which is placed at the distance from 800 mm to 1400 mm with the proposed method, the Microsoft Kinect v1, Mesa Imaging SwissRanger SR4000 ToF camera and the Fourier transform profilometry (FTP). At each distance, the experimental platform is aligned and the axis is perpendicular to the reference plane. To exclude the calibration errors as much as possible, the depth devices are utilized to measure each position of the plane more than 10 times without moving or vibrating the devices. The fitting plane calculated by the least squares algorithm is regarded as the ground truth. The root mean square error (RMSE) is used as the benchmark to evaluate their performances. As shown in Fig. 11a, the RMSE increases as the plane moves away from the measurement system. The performance of the proposed method is better than that of the other algorithms in precision.

a the RMSE of a plane at different distances, b the RMSE of a fixed plane with different patterns at 1000 mm
In addition, we also add 20dB Gaussian noise to the acquired images to evaluate the robustness of the proposed method. As shown in Fig. 11a, the RMSE of the proposed method increases after the noise is added. But the add noise situation also achieves better performance than that of the FTP method and ToF camera.
To make the improvement of the proposed method clearer, we also compute the 95% confidence interval of the proposed method. The confidence interval is calculated as \(\bar x \pm {z^ * }\frac {\sigma }{{\sqrt n }}\), where \(\bar x\) is the mean, σ is the standard deviation, n is the sample size, and z∗ represents 1.96 for the 95% confidence level. The result is shown in Table 2.
From the confidence intervals, we can conclude that the proposed method has better performance than the Kinect v.1, the ToF camera and the FTP. The 95% confidence interval of the added noise situation presented in Table 2 also shows the robustness against noise of the proposed method.
As we known, the precision of the depth sensing is relative with the period of the fringe pattern. In the second experiment, the flat plane is fixed at the distance of 1000 mm. And different patterns are projected to measure the depth of the plane. The carrier frequencies of these patterns are the same, but the periods of the modulated fringe image 1/f p are 18, 27, 36, 45, 54 pixels respectively. The RMSE results are shown in Fig. 11b. With the increase of the periods, the RMSE rises from 2.95 mm to 8.21 mm. This demonstrates that the small period is the optimal choice for the depth sensing. Considering the resolutions of the projector and the camera, we choose the period of the modulated fringe image 1/f p as 18 pixels in the following experiments.
In a triangulation system as shown in Fig. 12. O p is the optical center of the projector and O c is the optical center of the camera. b represents the baseline between the camera and the projector. f is the focal length of the camera. Point C locates at the distance of L and point A is at the distance of L−ΔL. The difference between the correspondence pixels to A and C is Δd. From similar triangles, we have

The triangulation system
So the relationship between ΔL and Δd can be represented as
Equation 14 shows that the expected error ΔL on its depth L is almost proportional to the distance squared L2. To compare the proposed algorithm with the theoretical precision of triangulation systems, we choose corresponding error Δd=0.5 pixel, Δd=1 pixel and compute the depth precision ΔL according to Eq. 14. The baseline b and camera focal length f is attained by the calibration of our experimental platform. As shown in Fig. 13, the RMSE increases with the depth increasing. The precision of the proposed algorithm lies between the theoretical precision when Δd=0.5 pixel and Δd=1 pixel.

Comparison with the theoretical precision of triangulation systems
To estimate the improvement of the proposed method compared with the traditional phase unwrapping method, we utilize the proposed method and the Fourier transform profilometry (FTP) to measure a challenging scene. As shown in Fig. 2a, two planes overlap each other and they are placed at 140 cm and 150 cm, respectively. For the FTP, we use the classic quality-guided flood-fill phase unwrapping algorithm in [34] to get the unwrapped phase. The quality-guided flood-fill algorithm calculates the unwrapped phase from connected neighborhood under the assumption that the phase is continuous. This assumption is against this specific scene because the boundary between the two planes is a sharp edge. As illustrated in Fig.14a and c, the depth acquired by the flood-fill phase unwrapping method contains obvious errors. The sharp edge between the two planes is blurred seriously. Different from the traditional phase unwrapping algorithms, the proposed method firstly detects two continuous regions in the scene. Then the unwrapped phase is calculated in each continuous region. As shown in Fig. 14b and d, the proposed method measures the depths of the two planes correctly and the boundary is sharp as well.

Comparison results of the proposed method and the flood-fill phase unwrapping method [34]. a plot one row of the depth estimated by the flood-fill method, b plot one row of the depth estimated by the proposed method, c depth map acquired by the flood-fill method, d depth map acquired by the proposed method
Qualitative evaluation
In this section, real scenes of multiple objects are measured with our experimental platform. All the objects are placed at the distance of 1800 mm from the experimental platform. As shown in Fig. 15a, a plaster sculpture and a plaster vase are in the scene. The vase casts shadows onto the sculpture. In Fig. 15c, the wrapped phases of the two separate objects connect at the upper right corner of the vase. The continuous region is zoomed in and presented in Fig. 8b. The proposed region detection algorithm can determine the two continuous regions as shown in the small color map in Fig. 15c. For visualization, the MeshLab software is utilized to get the 3D reconstruction of the scene. As shown in Fig. 15e, the boundaries of the objects are clear. The hair style and eye of the sculpture can be found. The wave-like artifacts on the reconstruction result are less than 1 mm in numerical. The MeshLab software we used magnifies the artifacts visually.

A plaster sculpture and a vase. a the scene, b the acquired image after projecting the pattern, c the wrapped phase map (the small color figure is the region detection result), d the depth map, e 3D reconstruction result (the small figure is another view of the reconstruction result)
In Fig. 16a, there are a plaster vase and a cuboid in the scene. The boundary between the two objects almost fit a vertical line. The wrapped phase is zoomed in and given in Fig. 8c. As shown in the small color figure in Fig. 16c, the scene is segmented into two continuous regions. The unwrapped phase is computed in each continuous region separately. Restricted by the proposed three criteria, the period numbers are recovered and the depth is calculated reliably.

A plaster vase and a cuboid. a the scene, b the acquired image after projecting the pattern, c the wrapped phase map (the small color figure is the region detection result), d the depth map, e 3D reconstruction result (the small figure is another view of the reconstruction result)
In the third scene, a soft pillow and a plaster geometry are measured. The texture of the pillow is different from that of the plaster objects as shown in Fig. 17a. The unwrapped phase is shown in Fig. 17c. Though the albedo of the two objects are different, the proposed method segments them successfully. This demonstrates the reliability and robustness of the Gabor filter and the continuous region detection approach we utilized. Because the front geometry throws shadows onto the pillow, there are holes between the two objects on the final depth result.

A soft pillow and a plaster geometry. a the scene, b the acquired image after projecting the pattern, c the wrapped phase map (the small color figure is the region detection result), d the depth map, e 3D reconstruction result (the small figure is another view of the reconstruction result)
As shown in Fig. 18, there are a metal bookend, a paper box, a stuffed toy and a melon in the scene. The measured objects have different colors and reflectivity. They are placed at different distances to the camera. From the result as shown in Fig. 18b, we can find the proposed method can recover the complex scene. And our method can present details in the scene.

a color scene, b depth acquired by the proposed method
We also adopt the proposed method to measure a complex plaster sculpture. The results are shown in Fig. 19. We can see that the proposed method can acquire dense and precise depth maps. The hairstyle texture, the face, the eyes and the nose are clear in our results.

Results of a plaster sculpture in different viewpoints. From top-to bottom: depth maps acquired by the proposed method and 3D reconstruction results
Conclusion
In this paper, a single-shot period-coded fringe pattern is proposed for depth sensing. Besides the fringe pattern, another pattern is utilized to code the period numbers of the fringe pattern. The period-code pattern is not simply added into the fringe image. Instead, we adopt the frequency division multiplexing algorithm to modulate the two patterns into a one-shot pattern. Therefore, the phase information and the period cue are transmitted simultaneously. In the acquired image, the wrapped phase is attained by the Gabor filter. A region detection algorithm is proposed to segment the scene into continuous regions. The unwrapped phase is computed in every continuous region. To guarantee the reliability of the unwrapped phase, the period numbers are first recovered from a statistic and the De Bruijn sequence. Then, three criteria are used to rectify the period numbers. Practical experiments prove that the proposed method can realize reliable depth sensing with off-the-shelf devices.
Abbreviations
- FDM:
-
frequency-division-multiplexing
- SLI:
-
structured light illumination
References
Geng, J: Structured-light 3d surface imaging: a tutorial. Adv. Opt. Photon. 3(2), 128–160 (2011).
Takeda, M, Mutoh, K: Fourier transform profilometry for the automatic measurement of 3-d object shapes. Appl. Opt. 22(24), 3977–3982 (1983).
Boyer, KL, Kak, AC: Color-encoded structured light for rapid active ranging. IEEE Trans. Pattern Anal. Mach. Intell.PAMI-9(1), 14–28 (1987).
Maruyama, M, Abe, S: Range sensing by projecting multiple slits with random cuts. IEEE Trans. Pattern Anal. Mach. Intell. 15(6), 647–651 (1993).
Hugli, H, Maitre, G: Generation and use of color pseudo random sequences for coding structured light in active ranging. In: 1988 International Congress on Optical Science and Engineering, pp. 75–82. International Society for Optics and Photonics, Washington (1989).
Le Moigne, J, Waxman, AM: Multi-resolution grid patterns for building range maps. In: Applied Machine Vision Conference, pp. 22–39. Society of Manufacturing Engineers, Dearborn (1985).
Sagawa, R, Ota, Y, Yagi, Y, Furukawa, R, Asada, N, Kawasaki, H: Dense 3d reconstruction method using a single pattern for fast moving object. In: 2009 IEEE International Conference on Computer Vision, pp. 1779–1786. IEEE, Washington (2009).
Griffin, PM, Narasimhan, LS, Yee, SR: Generation of uniquely encoded light patterns for range data acquisition. Pattern Recogn. 25(6), 609–616 (1992).
Posdamer, J, Altschuler, M: Surface measurement by space-encoded projected beam systems. Comput. Graph. Image Process. 18(1), 1–17 (1982).
Inokuchi, S, Sato, K, Matsuda, F: Range imaging system for 3-d object recognition. In: Proceedings of the International Conference on Pattern Recognition, vol. 48, pp. 806–808. IEEE, Silver Spring (1984).
Caspi, D, Kiryati, N, Shamir, J: Range imaging with adaptive color structured light. IEEE Trans. Pattern Anal. Mach. Intell. 20(5), 470–480 (1998).
Srinivasan, V, Liu, H-C, Halioua, M: Automated phase-measuring profilometry of 3-d diffuse objects. Appl. Opt. 23(18), 3105–3108 (1984).
Xiong, Z, Zhang, Y, Wu, F, Zeng, W: Computational depth sensing: Toward high-performance commodity depth cameras. IEEE Signal Proc. Mag. 34(3), 55–68 (2017).
Gorthi, SS, Rastogi, P: Fringe projection techniques: whither we are?Opt. Lasers Eng. 48(IMAC-REVIEW-2009-001), 133–140 (2010).
Creath, K: Phase-shifting speckle interferometry. In: 29th Annual Technical Symposium, pp. 337–346. International Society for Optics and Photonics, Washington (1985).
Zheng, S, Chen, W, Su, X: Adaptive windowed fourier transform in 3-d shape measurement. Opt. Eng. 45(6), 063601–063601 (2006).
Zhong, J, Weng, J: Phase retrieval of optical fringe patterns from the ridge of a wavelet transform. Opt. Lett. 30(19), 2560–2562 (2005).
Zhong, J, Weng, J: Dilating gabor transform for the fringe analysis of 3-d shape measurement. Opt. Eng. 43(4), 895–899 (2004).
Zhang, S, Li, X, Yau, S-T: Multilevel quality-guided phase unwrapping algorithm for real-time three-dimensional shape reconstruction. Appl. Opt. 46(1), 50–57 (2007).
Gutmann, B, Weber, H: Phase unwrapping with the branch-cut method: role of phase-field direction. Appl. Opt. 39(26), 4802–4816 (2000).
Baldi, A: Phase unwrapping by region growing. Appl. Opt. 42(14), 2498–2505 (2003).
Chen, CW, Zebker, HA: Network approaches to two-dimensional phase unwrapping: intractability and two new algorithms. JOSA A. 17(3), 401–414 (2000).
Zheng, D, Da, F: Phase coding method for absolute phase retrieval with a large number of codewords. Opt. Express. 20(22), 24139–24150 (2012).
Wang, Y, Zhang, S: Novel phase-coding method for absolute phase retrieval. Opt. Lett. 37(11), 2067–2069 (2012).
Zhang, S: Composite phase-shifting algorithm for absolute phase measurement. Optics Lasers Eng. 50(11), 1538–1541 (2012).
Wang, Y, Liu, K, Hao, Q, Lau, DL, Hassebrook, LG: Period coded phase shifting strategy for real–time 3-d structured light illumination. IEEE Trans. Image Process. 20(11), 3001–3013 (2011).
Zhang, Y, Xiong, Z, Wu, F: Unambiguous 3d measurement from speckle-embedded fringe. Appl. Opt. 52(32), 7797–7805 (2013).
Zhang, Y, Xiong, Z, Yang, Z, Wu, F: Real-time scalable depth sensing with hybrid structured light illumination. IEEE Trans. Image Process. 23(1), 97–109 (2014).
Shi, G, Yang, L, Li, F, Niu, Y, Li, R, Gao, Z, Xie, X: Square wave encoded fringe patterns for high accuracy depth sensing. Appl. Opt. 54(12), 3796–3804 (2015).
Budianto, B, Lun, DP-K, Hsung, T-C: Marker encoded fringe projection profilometry for efficient 3d model acquisition. Appl. Opt. 53(31), 7442–7453 (2014).
Cong, P, Xiong, Z, Zhang, Y, Zhao, S, Wu, F: Accurate dynamic 3d sensing with fourier-assisted phase shifting. IEEE J. Sel. Top. Signal Process. 9(3), 396–408 (2015).
Salvi, J, Pages, J, Batlle, J: Pattern codification strategies in structured light systems. Pattern Recogn. 37(4), 827–849 (2004).
Sagawa, R, Kawasaki, H, Kiyota, S, Furukawa, R: Dense one-shot 3d reconstruction by detecting continuous regions with parallel line projection. In: 2011 IEEE International Conference on Computer Vision, pp. 1911–1918. IEEE, Washington (2011).
Ghiglia, DC, Pritt, MD: Two-dimensional phase unwrapping: theory, algorithms and software, vol. 4. Wiley, New York (1998).
Acknowledgements
Lili Yang’s contribution was made when she was a visiting PhD student at the Australian National University, sponsored by the China Scholarship Council (CSC). This work was supported in part by the NSFC (No. 61672404, 61632019, 61472301, 61301288 and 61572387), the Fundamental Research Funds of the Central Universities of China (No. SA-ZD 160203, JBG160228, JBG160213, K5051399020 and K5051202050), and Natural Science Basic Research Plan in Shaanxi Province of China (Program No. 2016ZDJC-08).
Funding
Declared at acknowledgements.
Availability of data and materials
Presented in the main paper.
Author details
Lili Yang received the B.S. degree from Xidian University in 2010. She is currently pursuing the Ph.D. degree from Xidian University. Since 2017, she is a visiting Ph.D student at Australian National University. Her research interests are depth sensing, signal processing and depth image restoration. Lili.Yang.research@gmail.com.
Fu Li was born in 1982. He got his B.S. and Ph.D. degrees from Xidian University in 2004 and 2010 respectively. From 2010 to 2011, he had studied in the Microsoft Research Asia (MSRA). Currently, he is an Associate Professor in Xidian University. His research interests are depth sensing, nonlinear signal processing, HEVC architecture design, and VLSI design. fuli@mail.xidian.edu.cn.
Guangming Shi received the B.S. degree in automatic control, the M.S. degree in computer control, and the Ph.D. degree in electronic information technology from Xidian University, Xi’an, China, 1985, 1988, and 2002, respectively. He joined the School of Electronic Engineering, Xidian University, in 1988. From 1994 to 1996, he was a Research Assistant with the Department of Electronic Engineering, University of Hong Kong. Since 2003, he has been a Professor with the School of Electronic Engineering, Xidian University, and, since 2004, the Head of the National Instruction Base of Electrician & Electronic (NIBEE). In 2004, he had studied with the Department of Electronic Engineering, University of Illinois at Urbana-Champaign, Urbana. Currently, he is the Deputy Director of the School of Electronic Engineering, Xidian University, and the Academic Leader of the subject of circuits and systems. He has authored or co-authored over 60 research papers. His current research interests include compressed sensing, theory and design of depth sensing, multirate filter banks, image denoising, low-bit-rate image/video coding and implementation of algorithms for intelligent signal processing (using DSP&FPGA). gmshi@xidian.edu.cn.
Ruodai Li received the B.S. degree from Zhengzhou University in 2012. He is currently pursuing the Ph.D. degree from Xidian University. His research interests are depth sensing and signal processing. ruodai.li@foxmail.com.
niuyi@mail.xidian.edu.cn.
Zhefeng Gao received the B.S. and M.S. degrees from Xidian University in 2014 and 2017, respectively. Now, he is a Research Member with the Hytera Company. zhefeng.gao@gmail.com.
Pingfang Dou received the B.S. and M.S. degrees from Xidian University in 2014 and 2017, respectively. Now, she is a Research Member with the Baidu Company. pf_dou@163.com.
Author information
Authors and Affiliations
Contributions
LLY proposed the idea, carried out the experiments and wrote the manuscript. RDL carried out the analysis of the theoretical precision of triangulation systems. FL and YN participated in the discussion of the experiments. All authors read and approved the final manuscript.
Corresponding author
Ethics declarations
Competing interests
The authors declare that they have no competing interests.
Publisher’s Note
Springer Nature remains neutral with regard to jurisdictional claims in published maps and institutional affiliations.
Rights and permissions
Open Access This article is distributed under the terms of the Creative Commons Attribution 4.0 International License(http://creativecommons.org/licenses/by/4.0/), which permits unrestricted use, distribution, and reproduction in any medium, provided you give appropriate credit to the original author(s) and the source, provide a link to the Creative Commons license, and indicate if changes were made.
About this article

Cite this article
Yang, L., Li, F., Shi, G. et al. Frequency-division-multiplexing based period-coded fringe pattern for reliable depth sensing. J. Eur. Opt. Soc.-Rapid Publ. 14, 2 (2018). https://doi.org/10.1186/s41476-017-0070-8
Received:
Accepted:
Published:
DOI: https://doi.org/10.1186/s41476-017-0070-8